


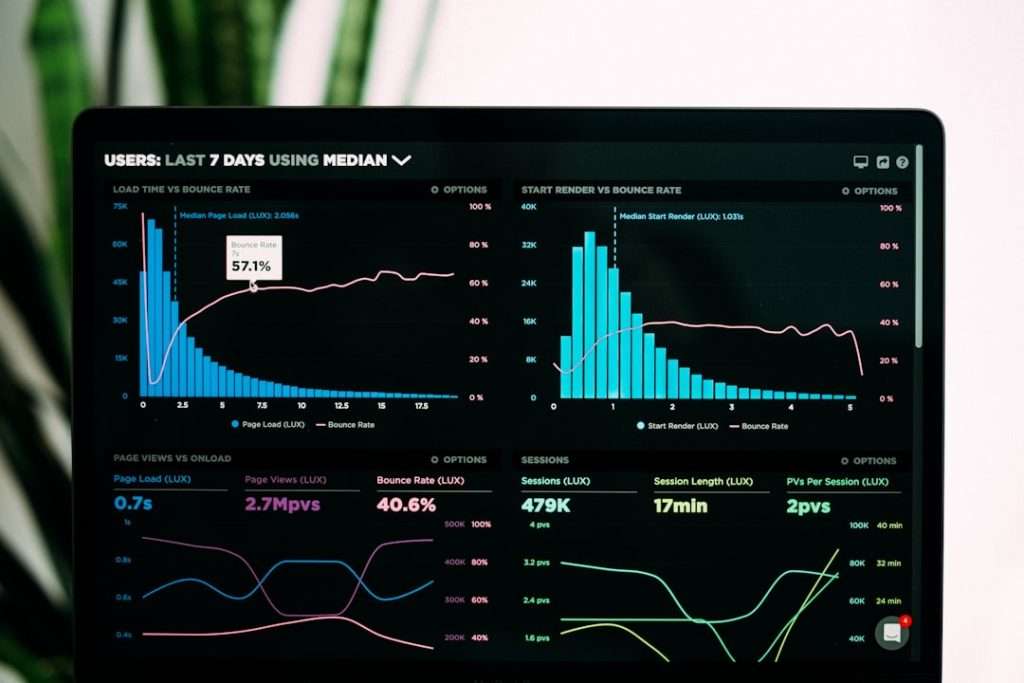
Infrastructure monitoring is like a health tracker for your servers, apps, databases, containers, and clouds. Datadog is one of the biggest names in this space. It is powerful, shiny, and packed with features. But it is not the only dog in the park.
TLDR: Datadog is great for full-stack monitoring, but it can get expensive fast. Good competitors include New Relic, Dynatrace, Prometheus, Grafana Cloud, Splunk Observability, and Elastic Observability. For example, a small SaaS team running 80 cloud instances might cut monitoring costs by 30% to 50% by moving from Datadog to Grafana Cloud or an open-source Prometheus setup. The best choice depends on your team size, budget, cloud setup, and how much automation you want.
Why Look for a Datadog Alternative?
Datadog does many things well. It monitors infrastructure, logs, apps, user sessions, security events, networks, and more. That is cool. It is also a lot.
For some teams, Datadog feels like a spaceship when they only need a bicycle. The dashboards are slick. The alerts are strong. The integrations are huge. But pricing can become hard to predict.
You may want a competitor if you need:
- Lower costs for growing cloud workloads.
- Open-source tools with more control.
- Simpler setup for small teams.
- Better AI automation for large enterprises.
- Stronger log search or security features.
Now let’s compare the best Datadog competitors. No jargon soup. Just the tasty bits.
1. New Relic: Best All-Round Datadog Rival
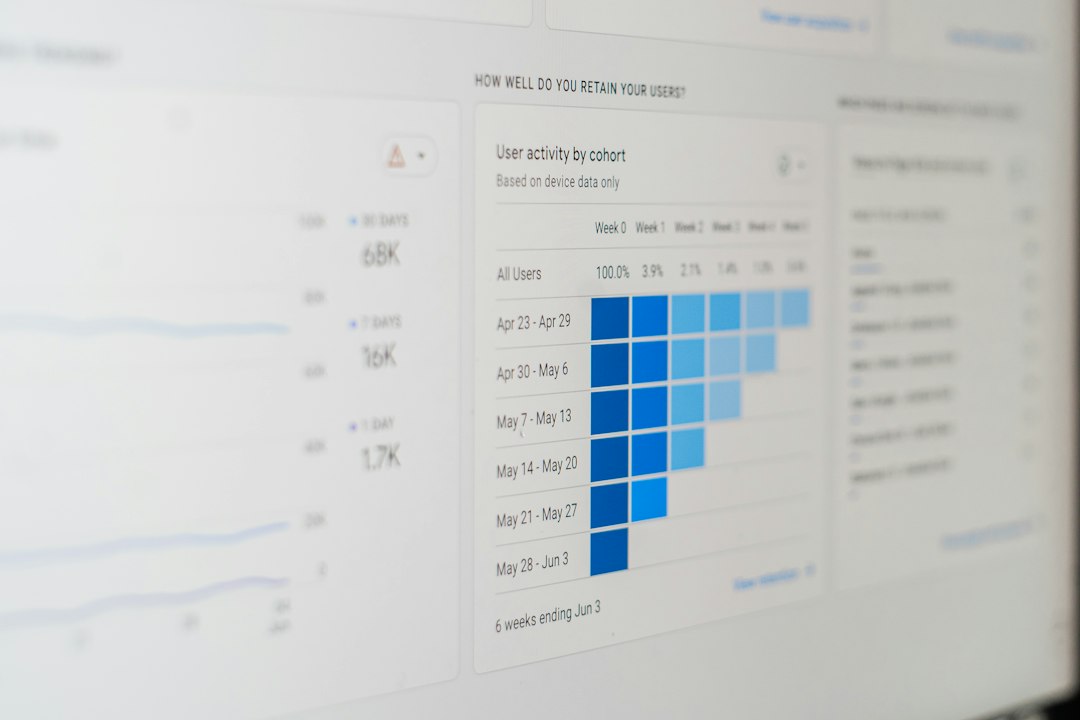
New Relic is one of the closest Datadog competitors. It covers infrastructure monitoring, application performance monitoring, logs, errors, browser monitoring, mobile monitoring, and synthetic tests.
It is strong when you want one platform for both developers and operations teams. The interface is friendly. The setup is not scary. You get deep views into app performance and infrastructure health.
Best for: SaaS teams, product teams, and companies that want full-stack observability.
Pros:
- Great application performance monitoring.
- Useful free tier for smaller teams.
- Good dashboards and alerts.
- Simple user experience.
Cons:
- Pricing can still rise with heavy data use.
- Advanced features may require careful setup.
Fun take: If Datadog is a Swiss Army knife, New Relic is another Swiss Army knife with a slightly different grip.
2. Dynatrace: Best for Enterprise Automation
Dynatrace is built for big systems. Think banks, airlines, global ecommerce, and large cloud platforms. It uses AI to detect problems, map dependencies, and point teams toward root causes.
This is where Dynatrace shines. It does not just say, “Something is broken.” It tries to say, “This service is slow because this database call changed after this deployment.” That is helpful. Very helpful.
Best for: Large enterprises with complex infrastructure.
Pros:
- Excellent automatic discovery.
- Strong AI-based root cause analysis.
- Great for Kubernetes and hybrid cloud.
- Powerful business impact tracking.
Cons:
- Can be expensive.
- May feel heavy for small teams.
Fun take: Dynatrace is like hiring a detective who also drinks espresso and reads server logs for breakfast.
3. Prometheus: Best Open-Source Infrastructure Monitoring
Prometheus is a favorite in the cloud-native world. It is open source. It is widely used with Kubernetes. It collects metrics and stores them as time-series data.
Prometheus is powerful, but it is not a full Datadog clone. It is more like a strong engine. You still need other parts, like dashboards, alerting, and long-term storage. Many teams pair it with Grafana.
Best for: DevOps teams, Kubernetes users, and open-source fans.
Pros:
- Free and open source.
- Great for Kubernetes metrics.
- Huge community support.
- Flexible query language.
Cons:
- Needs more manual setup.
- Long-term storage needs extra tools.
- Not ideal for teams without DevOps skills.
Fun take: Prometheus is the DIY monitoring gym. You save money, but you must lift the weights yourself.
Image not found in postmeta4. Grafana Cloud: Best for Dashboards and Flexible Observability
Grafana Cloud takes popular open-source tools and hosts them for you. It supports metrics, logs, traces, and profiles. It works with Prometheus, Loki, Tempo, and many other data sources.
The big win is flexibility. Grafana dashboards are famous for a reason. They look good. They are customizable. They help teams see what is happening fast.
Best for: Teams that love open-source tools but do not want to manage everything alone.
Pros:
- Beautiful and flexible dashboards.
- Works with many data sources.
- Good free and lower-cost options.
- Great fit for Prometheus users.
Cons:
- Can require tuning.
- Not as “automatic” as Dynatrace.
Fun take: Grafana Cloud is like giving your metrics a cool apartment with great lighting.
5. Splunk Observability: Best for Logs and Enterprise Data
Splunk is famous for log management. Splunk Observability adds infrastructure monitoring, application monitoring, real-user monitoring, and incident response features.
If your company already uses Splunk, this can be a logical choice. It is strong for teams that need to search huge amounts of machine data. It also works well for security and compliance-heavy environments.
Best for: Enterprises with heavy log and event data.
Pros:
- Excellent log search and analysis.
- Strong enterprise features.
- Good security and compliance fit.
- Useful incident response tools.
Cons:
- Can be costly.
- May feel complex for smaller teams.
Fun take: Splunk is the librarian of machine data. It can find the weird error message hiding in aisle 47.
6. Elastic Observability: Best for Search-Powered Monitoring
Elastic Observability is part of the Elastic Stack. It combines infrastructure metrics, logs, traces, uptime checks, and security data. It is built on Elasticsearch, which is fast at searching large datasets.
Elastic is a good pick if your team already uses Elasticsearch or Kibana. It gives you strong search, flexible dashboards, and good control over data.
Best for: Teams that want observability plus powerful search.
Pros:
- Strong log and data search.
- Flexible deployment options.
- Good for combining observability and security.
- Useful Kibana dashboards.
Cons:
- Setup can take time.
- Cluster management needs skill if self-hosted.
Fun take: Elastic is like a search engine for your infrastructure drama.
Quick Comparison Table
| Platform | Best For | Main Strength |
|---|---|---|
| Datadog | Full-stack observability | Huge feature set |
| New Relic | Product and app teams | Easy full-stack monitoring |
| Dynatrace | Large enterprises | AI automation |
| Prometheus | Kubernetes teams | Open-source metrics |
| Grafana Cloud | Dashboard lovers | Flexible visualization |
| Splunk Observability | Log-heavy enterprises | Machine data search |
| Elastic Observability | Search-first teams | Logs and analytics |

How to Choose the Right Platform
Start with your actual pain. Not the shiny demo. Not the sales video with dramatic music. Your pain.
- If your cloud bill is the monster, look at Prometheus or Grafana Cloud.
- If your apps are slow, compare Datadog, New Relic, and Dynatrace.
- If your logs are chaos, check Splunk or Elastic.
- If your team is small, choose something simple and managed.
- If your systems are huge, automation matters more than price alone.
Also test pricing with real numbers. Use your current host count, container count, log volume, and retention needs. A tool that looks cheap at 10 servers may look spicy at 500.
Final Verdict
Datadog is still a top infrastructure monitoring platform. It is polished, broad, and reliable. But the best tool is not always the biggest one.
New Relic is a great general alternative. Dynatrace is excellent for enterprise automation. Prometheus is perfect for open-source control. Grafana Cloud gives you flexible dashboards without as much maintenance. Splunk rules in log-heavy worlds. Elastic is strong when search matters.
The smart move is simple. Pick three tools. Run a two-week trial. Monitor the same services. Compare alert quality, setup time, dashboards, and total cost. Then choose the one your team will actually enjoy using. Because the best monitoring platform is the one that helps you fix problems before users start yelling.